APPLICATION UI
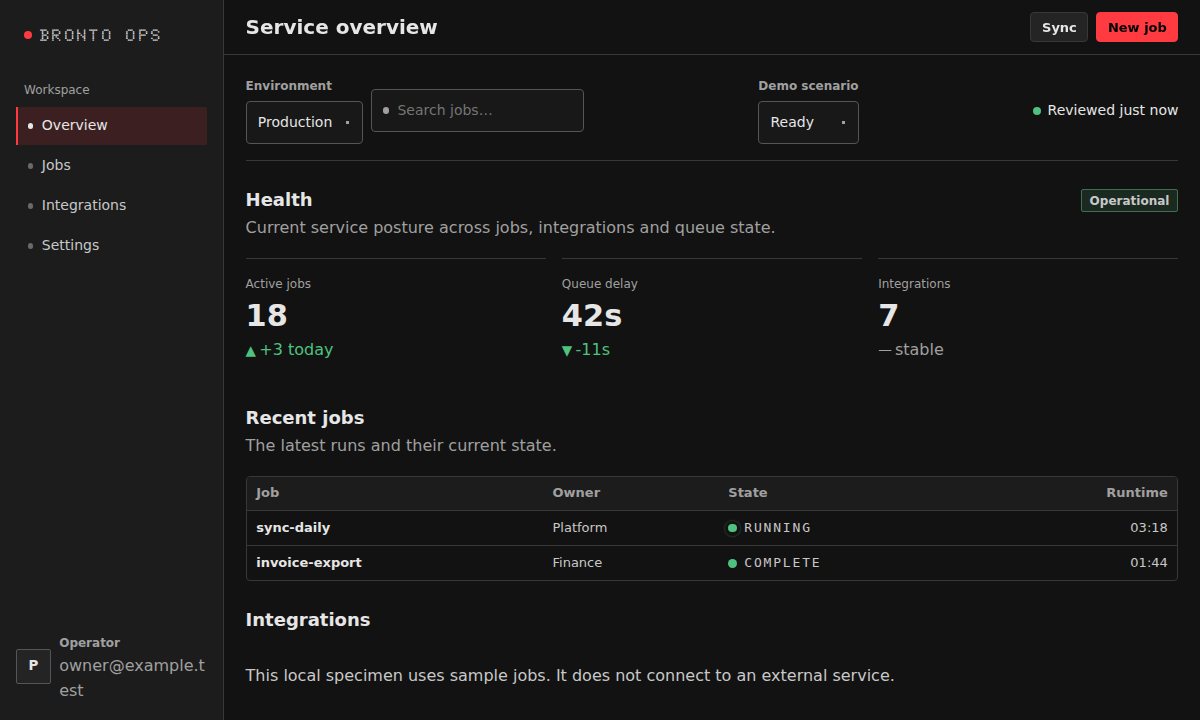
Operations dashboard
A full service shell with navigation, workload status, tables, filters, and operational feedback.
OPEN SOURCE / CSS-FIRST
Building blocks for developer tools, operational dashboards, and evidence-rich reports. Use plain HTML and CSS — keep your framework, your data, and your runtime.
01 / IN PRACTICE
Components make more sense when they are doing real work. Start with complete compositions, then inspect the pieces.
A full service shell with navigation, workload status, tables, filters, and operational feedback.
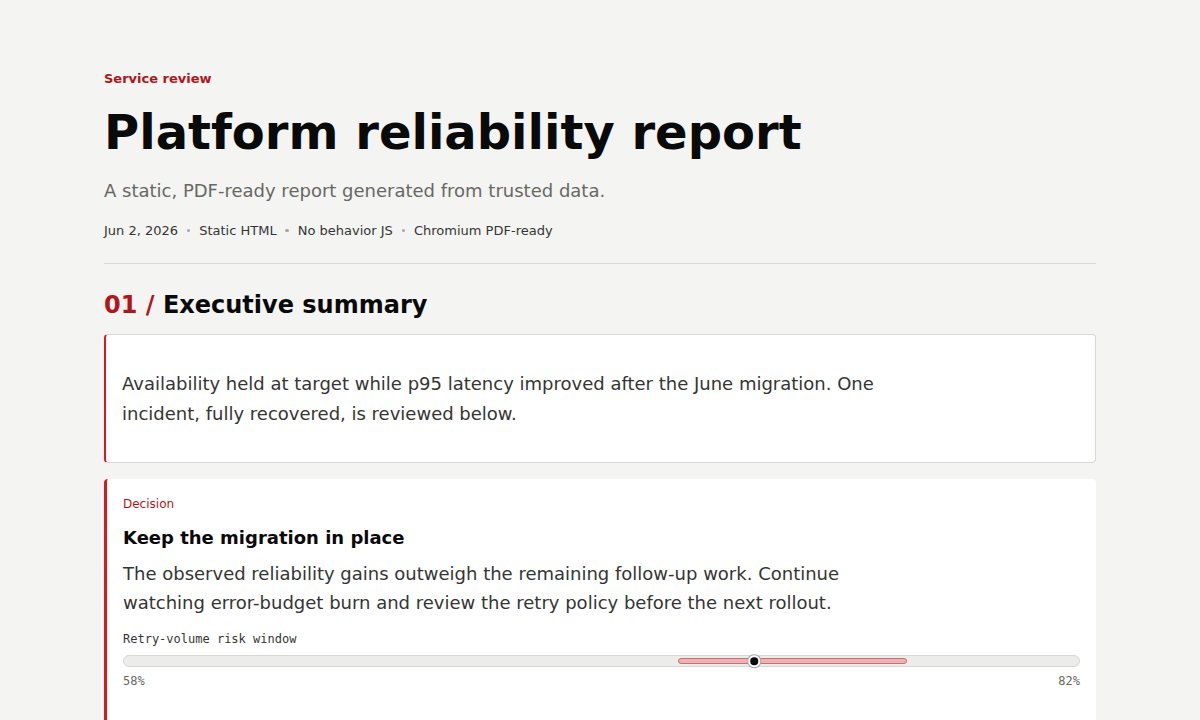
An evidence-oriented, print-ready platform report, rendered from ordinary HTML and CSS.
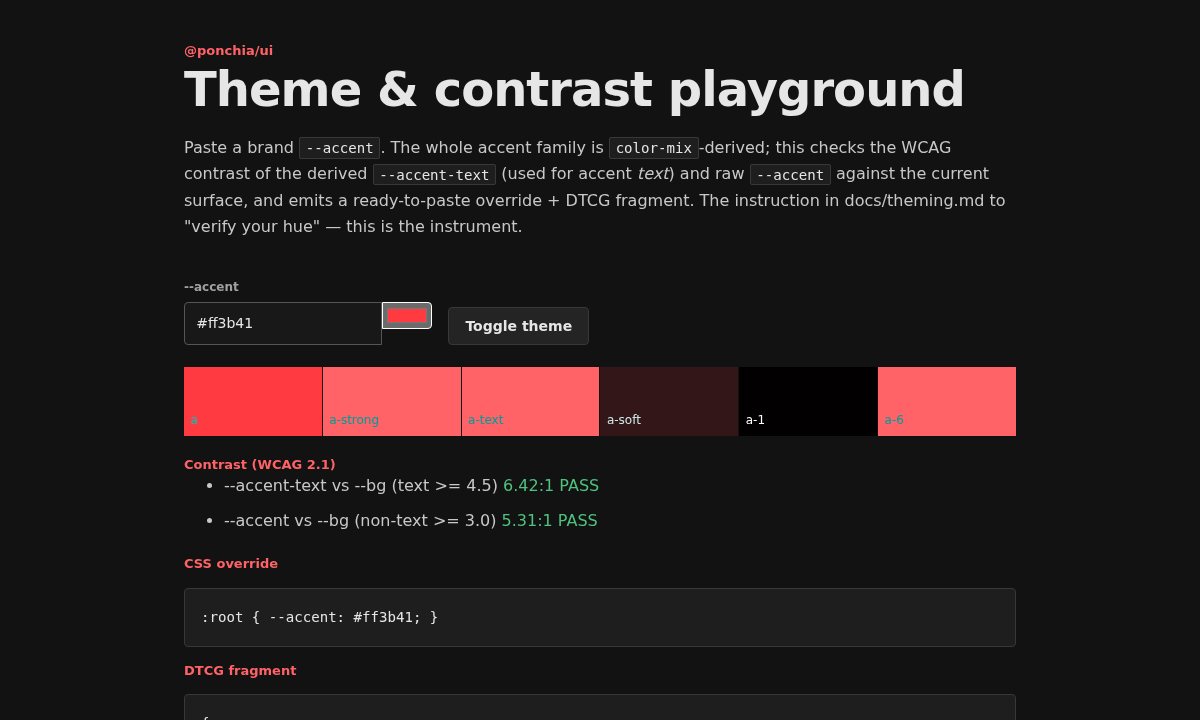
Change the accent, inspect generated color roles, and validate contrast without rebuilding your components.
02 / THE APPROACH
Bronto UI supplies the tokens, accessible visual patterns, and narrow behaviors. The application keeps ownership of its state and business logic.
Composable classes and optional JavaScript behaviors. No app architecture to adopt.
Shared typography, density, navigation, and semantic states across tools and reports.
Opt-in presentation primitives for annotations, evidence, charts, and printable reports.
03 / GET STARTED
Install the package, import the styles, and write ordinary semantic markup. Bring in a behavior only when you need one.
Follow a complete first-component walkthroughnpm install @ponchia/uiimport '@ponchia/ui';<button class="ui-button">Continue</button>
<span class="ui-badge ui-badge--success">Ready</span>Plain HTML without a bundler? Use the CDN stylesheet guide ↗
STILL EXPLORING?